Support analytics
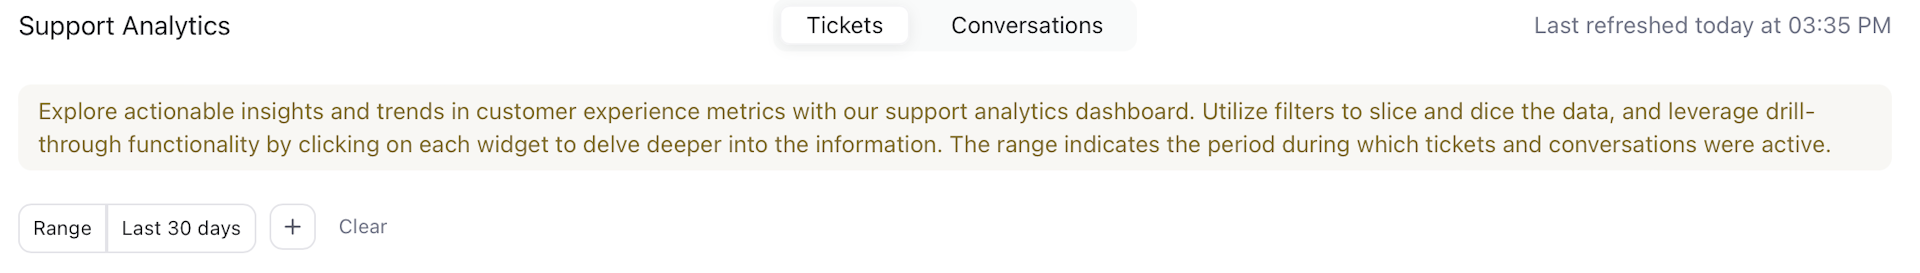
The support analytics is the gateway to actionable insights across a spectrum of customer experience metrics. Whether your focus is on blocker tickets, SLA compliance, or customer satisfaction, support analytics is the one-stop solution. Explore the depths of your data with dynamic filters and unravel more details using drill-through functionalities to understand the contributing factors behind each metric.
All metrics are calculated within the specified time range, managed by the default range filter. Additional filters can be added to get more specific analytics. However, not all filters apply to all the metrics and hence a warning symbol is displayed over the metric where the particular filter isn't applied.
All of these metrics undergo periodic refresh cycles, and you can track the last refresh time in the top right corner as shown below:
In optimal scenarios, rest assured that the data powering the support analytics metrics is no more than an hour old. This ensures you have access to the latest and relevant information for informed decision-making.
The support analytics utilizes browser-based analytics, which may cause a slight delay during the initial data load. However, the user experience is significantly enhanced once the data is cached in the browser, resulting in near-instantaneous dashboard loading thereafter.
Occasionally, the data might fail to load due to various reasons, leading to the display of the error message Failed to download data on the widget.
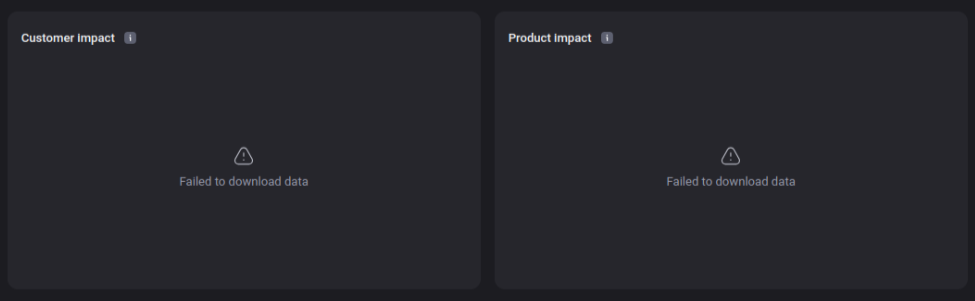
In such cases, refreshing the page after a brief pause should resolve the error. If the error persists, please raise a ticket, and someone from the team will assist you.
The support analytics derives meaningful patterns and information from past customer requests, problems, and interactions. As a result, past data persists even if the association is broken. For example, consider a part alpha in your product, which had 50 tickets associated with it in the past. Despite alpha being deleted last week, the data indicating that part alpha had 50 tickets still persists.
Tickets and conversations are the two main support objects and hence, the dashboard is divided into tickets-related and conversation-related customer experience metrics.